
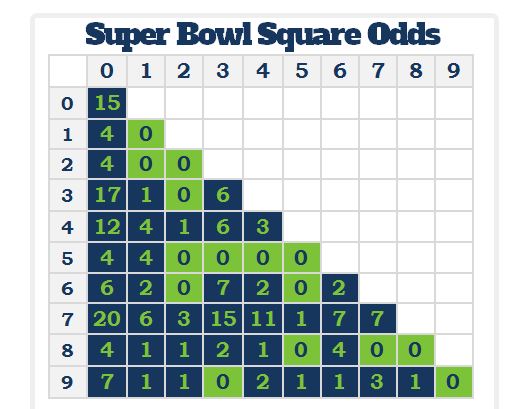
The chart above shows the number of times each possible number combination has appeared. There are a total of 200 quarters in the history of the Super Bowl. As you can see there are 15 different combinations that have never appeared in a Super Bowl and the number combination of 0 and 7 is the most popular, appearing 20 times.
To use this chart, simply find the largest of your 2 numbers in the left column, then the smallest of your 2 numbers in the top row. Where these numbers intersect will show the number of times this combination has happened at the end of any quarter of every Super Bowl.
How many times has each individual number has occurred? There are 400 possible single team scores. Based on the past 50 Super Bowls the numbers most likely to hit are as follows:
The number 0 appeared 108 times – 27%
The number 7 appeared 80 times – 20%
The number 3 appeared 60 times – 15%
The number 4 appeared 45 times – 11.25%
The number 6 appeared 33 times – 8.25%
The number 1 appeared 23 times – 5.75%
The number 9 appeared 17 times – 4.25%
The number 8 appeared 14 times – 3.5%
The number 5 appeared 10 times – 2.5%
The number 2 appeared 10 times – 2.5%
Best Numbers in Each Quarter
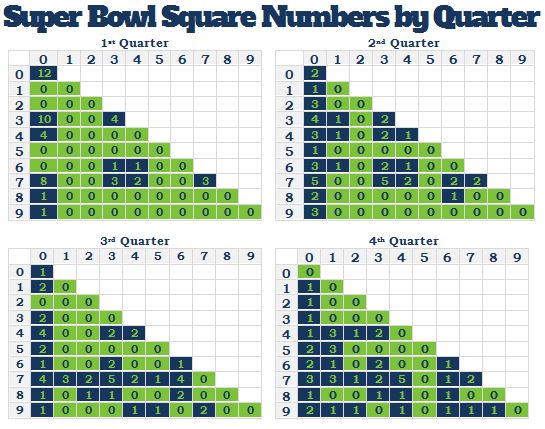
The most popular number combinations at the end of each quarter:
1st Quarter – 0,0
2nd Quarter – 0,7 and 3,7
3rd Quarter – 3,7
4th Quarter – 4,7